Continuing the listing of de Bruijn diagrams by looking at cycle diagramscycle diagram doesn't turn up much beyond what is already in Wuensche and Lesser's Atlas [11]; in fact after increasing the arrays in LCAU they now cover the same range.
|
The x's in Table 1.6 mark unavailable periods, but the limit to the lengths of periods increases exponentially leaving little point to trying to incorporate this detail into the table. Equally, there is an exponential limit to the lengths of prime cycles running across columns, to be noted alongside the fact that multiples of periods are periods.
|
Amongst these first sixteen cycle lengths are some which have periods too long for inclusion in Table 1.6; they are listed in Table 1.7.
But in both the de Bruijn diagrams and the basin diagrams there is an interesting item of note, the short height of the basin of attraction for the quiescent state (0, that is), which doesn't pass 9 and is frequently shorter.
The basin diagram for zeroes is cummulative, since anything which evolves to zero stays zero. But since a line of ones is the only alternative, it is interesting to see what produces ones for each ring circumference. That is where the small height is noticeable.
|
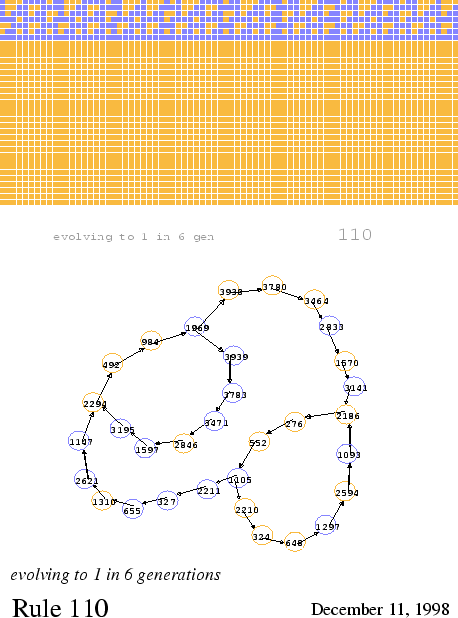
Note that cycles of length 10 seem to be favored. That also shows up in the de Bruijn diagrams for evolution to the constant value 1:
|
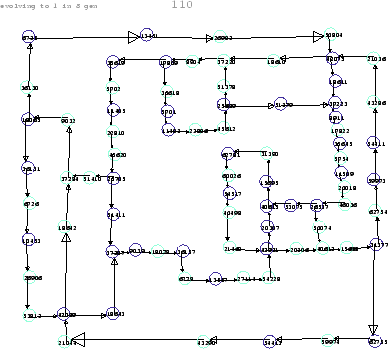
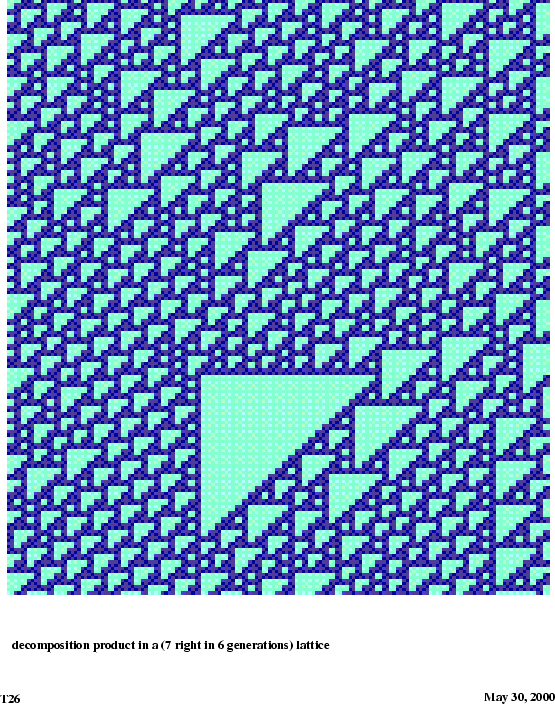
Upon further analysis it appears that the largest triangle which can possibly emerge from the evolutionary process is T42. Of course, larger triangles could be specified as part of an initial configuration, but otherwise they belong to a multiple generation Garden of Eden. Even so, the level ten de Bruijn diagram for evolution to 1 shows that up to ten generations, triangles of any size can be prearranged. The interest in the synthesis of T23 lies in the fact that, as a result of a composite glider collision of a D, a C2, and a packet of four B's, there is no limit to the delay that could be incurred while waiting for one of them to appear.
The de Bruijn diagram for evolution to the constant value 1 in nine generations is empty, which simply means that the diagram is acyclic, and its nucleus is empty. The full, unlabelled de Bruijn diagram has a quarter million nodes with half a million links. Appproximately half of these evolve to a single 1, of which another half can join with another link to produce a pair of 1's. Actually the percentage remains as high as a half but briefly, drops down to the order of ten percent, and continues to diminish. Altogether, a dozen or two chains remain, overlapping to a degree, with a length of 44 1's.
Since the resultant figure is acyclic, and there are two less 0's in the next generation than there were 1's in the current generation, T42 is the largest emergent tile. Of course, the initial configuration could have arbitrarily long strings of zeroes, whose remnants would still be encountered until the left expansivity of the right margin closed them off.
Except for the fact that the de Bruijn diagram is already quite large, graphs for additional generations could be examined to see whether the necessarily acyclic graphs would have even shorter transients, thereby limiting still further the maximum size of emergent tiles. Working from the opposite direction, finding initial conditions such as the proper positioning of gliders for a future collision, would establish lower limits to the size of emergent tiles.
 |
 |