 |
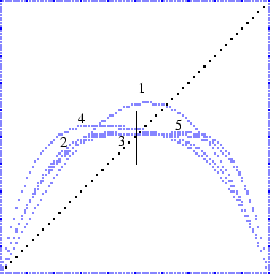
As Figure 1.28 shows, the distribution of cell states for Rule 110 tends quickly toward 50%, even though the a priori estimate favors 1's, and any strict alternation of 0's and 1's is ruled out. Note that the curves shown in the diagram are rigorously calculated mean field probabilities for successive composites, or generations of evolution, but that they tend to behave as iterates would.
Although they don't adhere to the first generation fixed point, they tend toward a superstable fixed point at 50%, while the fixed point at zero becomes ever more unstable.