Commentary related to Andrew Wuensche and Mike Lesser's book, ``The Global Dynamics of Cellular Automata.'' Addison-Wesley, 1992 (ISBN 0-201-55740-1) continues. We have described a ``statistical Gershgorin theorem'' which implies a maximum eigenvalue for a matrix related to an average row (or column) sum with an error term which may or may not be easy to estimate.
Applied to (2,1) automata, it implies that the A and B matrices which have been introduced will have an eigenvalue between 1 and 2, namely n/4, where n is the least amongst number of ancestors of 0 (called a) or of 1 (called b), respectively. The result is not too surprising, but also refers to the growth in the number of ancestors of a string of pure 0's or pure 1's. We want the rate of growth of mixtures, without knowing too much about the mix except maybe its percentage composition.
Eigenvalue 1 means the number of ancestors remains constant as the length of the configuration grows; eigenvalue 2 means it doubles with each new cell. As we said, no surprise here.
Turning to the pair matrix ![]() , which is also the second
moment matrix, the same reasoning gives us eigenvalues in the range 2 to 4,
namely
, which is also the second
moment matrix, the same reasoning gives us eigenvalues in the range 2 to 4,
namely ![]() . Whereas the average (first moment, computed from A+B),
just doubles as the number of cells increments, the second moment AT LEAST
doubles (when the ancestors are balanced) reaching a factor of 4, or
quadrupling, in the cases of extreme unbalance in rules 0 or 255.
. Whereas the average (first moment, computed from A+B),
just doubles as the number of cells increments, the second moment AT LEAST
doubles (when the ancestors are balanced) reaching a factor of 4, or
quadrupling, in the cases of extreme unbalance in rules 0 or 255.
In addition, numerical experiments show that ![]() is a good estimate
of the rate of increase; for a given a the rate has an average close to the
value in this formula with a small variance of its own (a variance in the
variance, if you wish).
is a good estimate
of the rate of increase; for a given a the rate has an average close to the
value in this formula with a small variance of its own (a variance in the
variance, if you wish).
Turning the second moment into variance and thence into standard deviation, there are still some approximations to be made.
![]()
the denominator 32 results from having to divide by ![]() , the number of
configurations. The coefficient g is a correction due to the smaller
eigenvalues of
, the number of
configurations. The coefficient g is a correction due to the smaller
eigenvalues of ![]() , which interfere with the principal
eigenvalue at first. Unless a=4, making us raise 1 to a power, subtracting
4 makes little difference.
, which interfere with the principal
eigenvalue at first. Unless a=4, making us raise 1 to a power, subtracting
4 makes little difference.
So, except for a factor, ![]() is a number between 1 and 2, raised to the
n/2 power (or, between 1 and 1.41 raised to the nth power).
is a number between 1 and 2, raised to the
n/2 power (or, between 1 and 1.41 raised to the nth power).
Is this result credible? Is it useful? Rule 0 in a ten-cell automaton
shows 1023 configurations with 0 ancestors, 1 with 4096 ancestors. This
works out to a standard deviation of about 128. At the other extreme,
Rule 150 has 4 ancestors per configuration, and zero standard deviation.
For Rule 22, we have ![]() , or about 3% increase for each additional
cell. Six percent interest doubles your money in ten or twelve years, so we
expect the standard deviation to double for each additional 20 to 25 cells
in the configuration. The same would be expected for all the 112 (2,1) rules
with unit imbalance, that is, ab=35.
, or about 3% increase for each additional
cell. Six percent interest doubles your money in ten or twelve years, so we
expect the standard deviation to double for each additional 20 to 25 cells
in the configuration. The same would be expected for all the 112 (2,1) rules
with unit imbalance, that is, ab=35.

To make some sense of averages and sigmas, we need to have a feel for what an extremely skewed frequency distribution we are dealing with. No matter how long the configuration, the average number of ancestors is still 4; to get such an average, around half the data must be 4 or under, which means that if Wuensche and Lesser's basin diagrams (NAT's) were for unrestricted configurations (theirs are periodic), somewhere around half of the nodes would have 4 incoming links or less. Quite a few more would have slightly more than that.
The standard deviation is supposed to tell how far out from the average the data ranges, which will be mostly on the high side for ancestor data. To get a feel for typical values, consider an 8-cell configuration for (2,1) Rule 22 without boundary conditions:
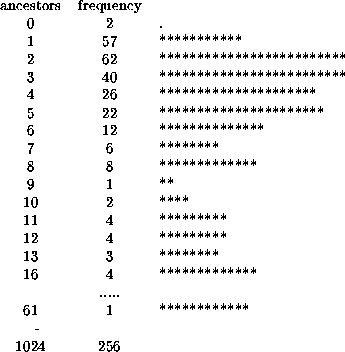
(1024 is gotten by multiplying number by frequency) The average is 4.0, sigma is 5.01; obviously that outlier is exerting an undue influence, but still 4-5=-1 to 4+5=9 does give a realistic approximation to where the data is. We are claiming that sigma will grow by about 3% for each new cell as the configuration is lengthened; at least from some point onward.
In fact, sigma behaves a bit more like ![]() , (that is, with a
multiplier of 1.069, or 7% growth) requiring about 5 iterations to double.
So the use of a, b and
, (that is, with a
multiplier of 1.069, or 7% growth) requiring about 5 iterations to double.
So the use of a, b and ![]() gives an approximation which is about
so good, no more.
gives an approximation which is about
so good, no more.
At least, there are some fairly general conclusions. One of the most important is that Langton's parameter is quite serviceable, although there are several things that could be called Langton's parameter, and their intended usage varies. All of them revolve around the idea of classifying the states by the fraction of neighborhoods which evolve into them, which is a portent of all kinds of things to come. One of them is the idea that as evolution progresses, an equilibrium must arise between the distribution of states and the distribution of ancestral neighborhoods.
Here we have seen that the statistics of ancestors depends on the neighborhood count by states in two ways. First, the dominant eigenvalue of the de Bruijn fragments is a direct function of this count - a multiple, in fact. Consequently the rate of growth for the number of ancestors of a string of like cells depends on the fraction of neighborhoods leading to that state. The biggest fraction always wins, in accordance with the principle that ``Them as has, gets.'' Moreover, mixed strings predominate pretty much according to their mix of the dominant state.
Such general statements are always subject to refinement and correction, but the overall principle is pretty well justified.
The second aspect of the statistics of ancestors that has been discussed is their variance, which depends on the sum of squares of percentages - again, on Langton's parameter. Variance grows as the length of a string of cells grows, although never as fast as the number of configurations, the same which is true for the number of ancestors itself. Longer strings can have more (and less) ancestors than the average. The average is small, so much less is hard to come by; neverless the concept is interesting for reversible and ``almost reversible'' automata.
In applying this analysis to the Atlas, it should be borne in mind that, as a matter of statistics, there are only one quarter as many configurations satisfying periodic boundary conditions as there are without boundary conditions (and in turn one sixteenth as many which are ``quiescent at infinity''). Thus the average number of ancestors for periodic configurations would be 1, not 4. Also, quantities may fluctuate more drastically for short configurations as the boundary conditions become more stringent.
In spite of this, growth factors apply equally for all kinds of boundary conditions. Moreover, once the powers of an irreducible matrix have come into equilibrium, fluctuations in the sizes of the matrix elements will also be immune to the boundary conditions, and they commence to dominate at the same stage as well.
More commentary will follow.