The most dramatic visualization of the spectral density arising from a continuum is to graph the wave functions side by side according to their energy dependence, normalized with their asymptotic amplitude unity. The resulting amplitude at the origin portrays the spectral density. Supposing that the amplitude at infinity signifies the strength of a current, the idea of a resonance or antiresonance surely depends on the observation that at some energies a unit current produces a maximum amplitude over the origin, while at other energies this amplitude will be at a minimum. What remains is to associate the maxima and their intervening minima with poles and zeros in the complex plane, complying with the idea that an analytic function is defined by its poles and their residues.
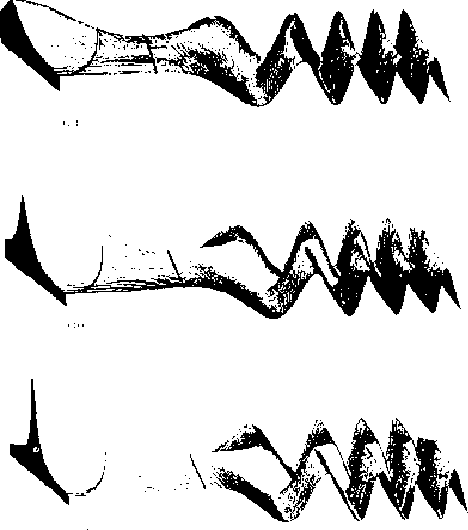
The process is illustrated in the accompanying figures by a series of computer-generated graphs The differential equation selected is the Dirac equation for a one-dimensional harmonic oscillator extending over the doubly infinite interval. Because the solutions are either even or odd the corresponding initial conditions can be chosen and the display of the solutions restricted to a single half interval.
Nikolsky [17] made the original investigation of the Dirac harmonic oscillator in 1930, finding its spectrum to be a continuum extending over the whole infinite interval He observed that although the spectrum was infinite in extent, it was not uniform, some wave functions having smaller asymptotic amplitudes than others. In 1935, Postepska [18] used the WKB method for a more detailed study of the solutions, examining the sharpening of the spectrum in the nonrelativistic limit. Motivated by a perturbation calculation of Sewell [19] which purported to exhibit the relativistic shift of the harmonic oscillator energy levels, Titchmarsh [20] analyzed the migration of the poles of a Green's function into the complex plane as a consequence of varying the velocity of light, finding an exponential variation in their distance from the real axis.
 |
 |
In the course of the three diagrams which constitute fig 1, we pass from a very light rest mass, which provides a very broad resonance, through a moderate resonance, and finally to a somewhat larger rest mass which produces a rather sharp resonance. In all cases the wave function has been normalized to unit amplitude at infinity, so that its amplitude over the origin will allow the poles of the spectral density to be located.
The classical turning points, both for positive and for negative energy states, have been indicated. As with the Schrödinger equation, these are points of inflection for the wave function, and mark the transition between a region of oscillatory behavior for the wave function and a region of exponential behavior. As the rest mass increases, the exponential region is enlarged, which makes the obtaining of a wave function with a large amplitude within the potential well increasingly difficult. In the limit, the nonrelativistic harmonic oscillator is seen to be an extraordinarily sharp resonance state, with essentially only one energy at which an interior amplitude is possible.
It is possible to observe quite clearly some other phenomena associated with resonance, for example, the fact that the asymptotic wave function undergoes a 180o phase shift on passing the resonance while gradually increasing the energy As the resonance narrows, the transition is increasingly abrupt.
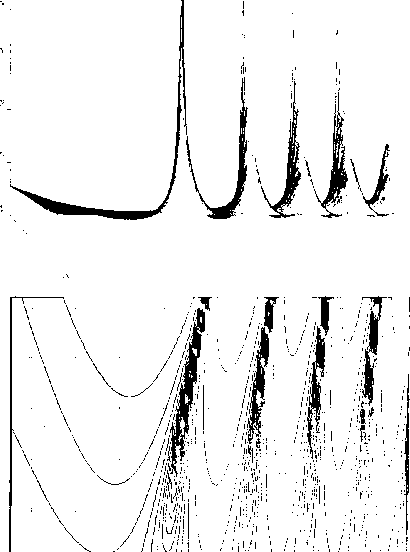
In the two diagrams comprising Fig 2 we summarize the spectral density with variation of energy and rest mass of the particle. Figure 2a is a perspective view of the function; Fig. 2b is a contour plot. The convergence of the spectral density to delta functions is quite evident.
Once a series of examples has been examined, the convenience of the m function in the solution of differential equations and in the presentation of the properties of those solutions can be appreciated. The origin of this function is mostly mathematical, arising in a natural way from Green's formula and the relationships between inner products in a general function space and in the space of boundary values for a differential operator. It is reassuring to see that it is so closely related to the S-matrix, which arose from highly physical considerations. Nevertheless the motivation was quite similar, to express the results of experiment directly in terms of initial conditions and physically observable quantities, without encountering too much detail about the actual dynamical processes.