 |
For small shift-period combinations it is feasible to scan the de Bruijn diagrams just to see the combinations, just as the small cycle diagrams yield useful information. Evolution to constancy is also readily available, as a consequence of which it was noticed that there was no kernel in the diagram for evolution to ones in nine generations, although the kernel of tghe diagram for evolution to ones in eight generations still has some structure, as seen in Figure 22.
That means that the nine generation diagram is acyclic. Since it is finite, there is an absolute limit to the length of configuration which can evolve to pure ones without repeating a portion. Since the next generation for any string of three or more ones would be pure zeroes, it follows that there is a limit on the size of triangles which can evolve from conditions other than already existing zeroes. Long sequences of zeroes always diminish, and new sequences only arise from sequences of ones.
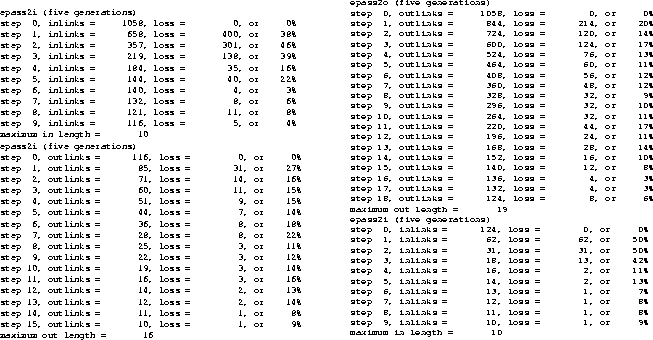
De Bruijn diagrams are Hamiltonian, which means that paths can run through as many as all the vertices without repeating. For nine generations the number is huge: 219 = 524,288. Subdiagrams and their kernels need not remotely approach this limit, but as a bound it is still finite. In terms of specific cases, found by exhaustive search, the longest chains turn out to be 44 cells long. Since the kernel searching program can be made to report the number of links each time an outer layer of leaves (or rootlets) are removed, it is possible to get some idea of the form of the acyclic diagram. The table of computer listing is long and not necessarily interesting in its entirity; but here are some excerpts.
ipass2i (nine generations - in links)
step  0, links =   281408, loss =         0, percentage =  0.00
step  1, links =   177048, loss =    104360, percentage = 37.08
step  2, links =   100354, loss =     76694, percentage = 43.32
...
step 41, links =      267, loss =        98, percentage = 26.85
step 42, links =      187, loss =        80, percentage = 29.96
step 43, links =       27, loss =       160, percentage = 85.56
step 44, links =        0, loss =        27, percentage = 100.00
maximum in length =       45
ipass2o (nine generations - out links)
maximum out length =        1
In this phase, the kernel program removes in-links, layer by layer, starting with a diagram containing 281,408 links altogether. Just over half the capacity of the de Bruijn diagram, it is just slightly more likely to evolve a one as a zero. For a while, about half the links are lost per cycle, reflecting the same tendency to slightly favor ones.
At the very end, there are still 27 links, which gives an idea of the number of chains, which is the number of rightmost neighborhoods. The program stops at step 25, when there are no more links. The second phase stops at once, there being no out links because there aren't any links at all.
The percentage lossage gives a rough idea of the branching of the acyclic binary graph. Half the content of a binary tree is in the leaves, but a minuscule part of an unbranched chain is in its leaf. Losing 85% of the leaves in step 43 implies that the termination of the ancestors didn't matter much.
For the sake of comparison, we present the same data, gotten by purging rootlets rather than leaves.
ipass2i (nine generations - in links)
step  0, links =   281408, loss =         0, percentage =  0.00
step  1, links =   208120, loss =     73288, percentage = 26.04
step  2, links =   160912, loss =     47208, percentage = 22.68
step  3, links =   124096, loss =     36816, percentage = 22.88
...
step 41, links =       96, loss =        96, percentage = 50.00
step 42, links =       32, loss =        64, percentage = 66.67
step 43, links =       16, loss =        16, percentage = 50.00
step 44, links =        0, loss =        16, percentage = 100.00
maximum out length =       45
maximum in length =        1
The results are rather similar, the main difference being that there were only sixteen links at the end, so there is more of a tendency of distinct ancestors to begin similarly. In the initial somewhat more links survived. But in either case, there are about a score of ancestors of a string of 44 links. According to the system of naming triangles, it is T42 which we are discussing.
 |
Figure 24 shows the evolution of one T42, confirming the existence of such tiles. It also shows the failure of an attempt to construct a T43 in eight generations, although tiles of any length can be constructed for seven generations. The easiest way to get them is to read them off the seventh stage evolution to constancy, but of course there are many more ways to torm them, depending on the transients in the same diagram.
It is an interesting result that the ancestors of T41 cannot be pushed back beyond twelve generations, so that it is also a nonemergent tile. It remains unknown how large an emergent triangle can be, although in the course of experimentation we have compiled a concordance, showing gliders and glider collisions which we have actually observed. So far the largest tile resulting from a collision is T23. Such an origin means that it can be produced after an arbitrarily large number of generations, simply by adjusting the initial positions of the colliding gliders