The cartesian product of graphs has many applications. As the upper
bound of two graphs, it compares paths between two different diagrams
(or two paths in the same diagram). It also appears in second moment
(and therefore variance) calculation of path frequencies. As an example,
Figure 14 shows the pair diagram (cartesian product of a graph
with itself) for the ![]() de Bruijn diagram of Figure 7.
de Bruijn diagram of Figure 7.
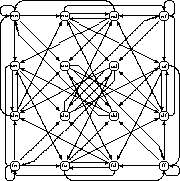
Figure 14: Sixteen node pair diagram for a ![]() de Bruijn diagram,
an image of which is visible along the diagonal as well as in
horizontal and vertical section.
de Bruijn diagram,
an image of which is visible along the diagonal as well as in
horizontal and vertical section.
Its connectivity matrix is
0.30em
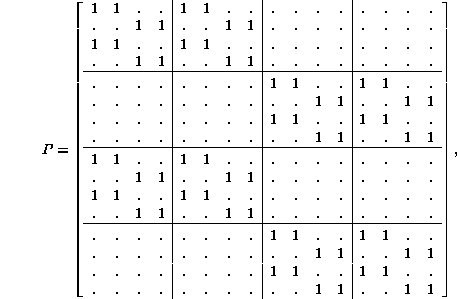
whose tensor product form is clearly visible.
It is not always necessary to distinguish between the members of a pair; the arrows in a graph require links to be defined as ordered pairs of nodes, but that does not necessarily require that a pair of links be taken in any particular order, for example.
Figure 15 shows the unordered pair graph of the two-stage
de Bruijn diagram for ![]() automata, whose connectivity matrix is
the symmetrized Kronecker product of the individual connectivity
matrices. It has fewer nodes, yet the full Kronecker product is
homomorphic to it, giving it computational and visual advantages.
automata, whose connectivity matrix is
the symmetrized Kronecker product of the individual connectivity
matrices. It has fewer nodes, yet the full Kronecker product is
homomorphic to it, giving it computational and visual advantages.
Both versions satisfy Richard's criterion [6] for duality, presumably participating in the same kind of dual chains as the de Bruijn diagrams themselves.
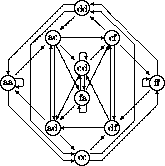
Figure 15: Ten node unordered pair diagram for a ![]() de Bruijn diagram,
an image of which (the diagonal) is visible around the circumference.
de Bruijn diagram,
an image of which (the diagonal) is visible around the circumference.
The connectivity matrix for unordered pairs is
0.50em
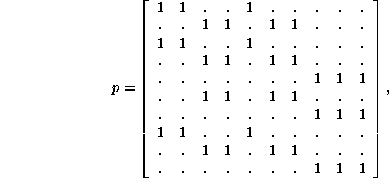
while the homomorphism matrix between the two versions is
0.50em
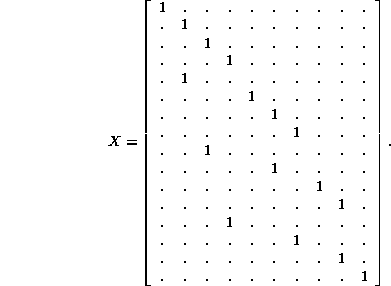
Multiplicities spoil comparing PX to Xp:
0.24em
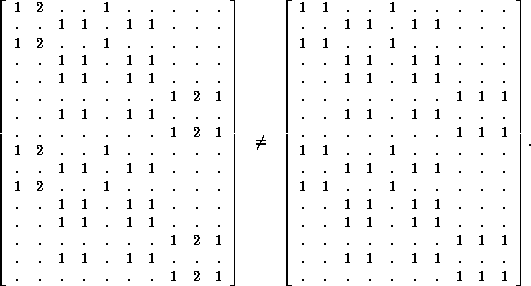
But the discussion surrounding Equations 3 and 16, gives a choice: 1) reduce PX to a boolean matrix whose nonzero entries are ones, or 2) weight the links in p with the number of links per pair to get a numerically valid comparison.